
College Football Likelihood of Scoring a Touchdown
Just a quick post here as I start digging into the excellent college football play-by-play database available at cfbstats.com.
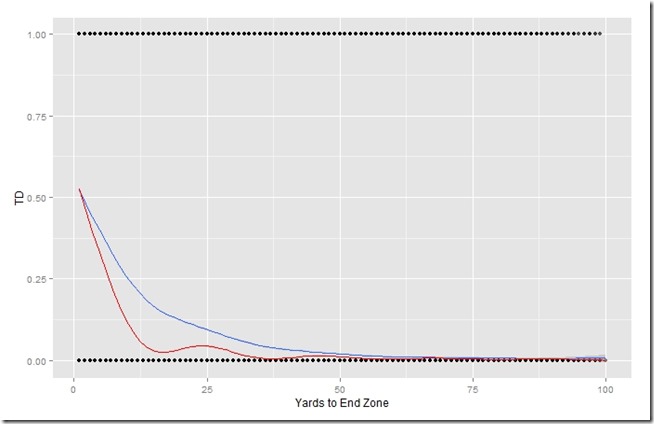
The database has touchdowns coded as either 1 or 0, so each play either is a touchdown, or isn’t. That made it extremely easy for me to produce the graph below, which shows the likelihood of scoring a touchdown depending on whether a play is a pass or run. Pass plays are represented by the blue line, while run plays are represented by the red line. There’s an interesting bump in the red line at the 25 yard line that I’ll probably try to dig into. The PBP database includes about 400,000 observations of both run plays and pass plays, so I suspect the bump is real. It could be the case that run plays from the 25 have the defense just a little more stretched out than a run play from say the 18 yard line, and therefore the odds of scoring a touchdown from the 25 are slightly greater. Anyway, it’s something interesting to look at further.
Run Plays = Red Line
Pass Plays = Blue Line
Further to the Interaction Between Quarterbacks and Receivers
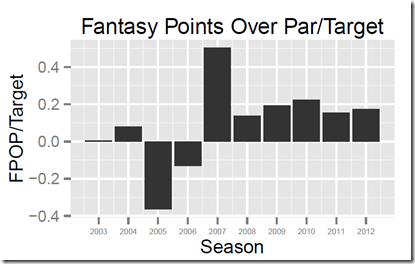
One of the challenges with any kind of a quantitative system in football is that the interactions between players are extremely difficult to get a handle on. In the simplest terms, when Matthew Stafford throws the ball to Calvin Johnson, how much credit should Stafford get for the play and how much credit should Johnson get? That’s as easy as it gets. Now what do you do when Stafford throws to Tony Sheffler who is open because the defense is primarily concerned with stopping Calvin Johnson? Who gets the credit for the play then? According to Advanced NFL Stats, the greatest season that Randy Moss has had since their numbers began was in 2000 when he added 0.16 Win Probability Added/game. During that same season ANS credits Duante Culpepper with 0.28 WPA/game. But I consider it more likely that Randy Moss had a larger effect on Culpepper’s value, than Culpepper did on Moss’. Culpepper hasn’t done anything without Moss, whereas Moss allowed all of Culpepper, Randall Cunningham, and Tom Brady to have career years throwing to him. So what are we to think then of the fact that Culpepper’s WPA exceeds Moss’ when Moss is probably having all sorts of impacts on the game which can’t be measured. This isn’t an argument against advanced stats or even against Brian Burke’s WPA formula. It’s just a continuation of my argument that there is more to a passing game than a franchise QB. Consider that for the 2006 season, ANS credits Tom Brady with .11 WPA/game. In 2007, his WPA jumps to .38 WPA/game. Consider also that for the 2008 season, ANS credits Matt Cassel with .18 WPA/game and then that number dives to –0.15 WPA/game when Cassel leaves the Patriots for the Chiefs. So the effect of adding and removing Randy Moss/Wes Welker was +0.27 in WPA/game for Tom Brady when he gained those WRs and it was –0.33 for Cassel when he lost those WRs! Also worth pointing out is that Matt Cassel with Moss/Welker was worth more in terms of WPA than Tom Brady before he had them. Probably an important point here is that I’m not arguing against the value of Tom Brady. This is a two way street. Consider the following graph which shows my fantasy scoring efficiency measure for Andre Johnson. You can see exactly when Matt Schaub got to Houston.
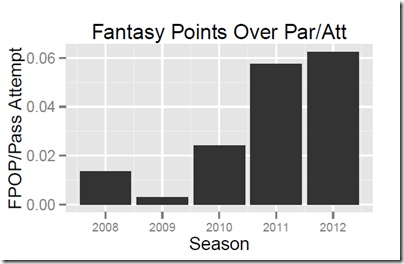
 But the relationship goes the other way too. Here is Matt Ryan’s fantasy scoring efficiency graph. You can clearly see when Julio Jones got to Atlanta.
 To go back to the Patriots and what happened when they added Randy Moss and Wes Welker, consider that according to Advanced NFL Stats, this would be the ordering of the passing games in terms of WPA during the 2006-2008 time period.
- Brady/Moss/Welker
- Cassel/Moss/Welker
- Brady/Reche Caldwell/Jabar Gaffney
Obviously the optimal situation is a franchise QB with two wide receivers who can get open at will. But dumpster-fire-QB with two wide receivers who can get open at will ends up beating the franchise QB with two scrub WRs.
A Half-hearted Defense of Brandon Weeden (Along With a Moneyball Strategy)
Going back to the 2005 draft, the Browns have used the following draft picks to select quarterbacks:
2012, 1st Round – Brandon Weeden
2010, 3rd Round – Colt McCoy
2007, 1st Round – Brady Quinn
2005, 3rd Round – Charlie Frye
The Browns’ record at selecting QBs isn’t very good and depending on how Brandon Weeden’s career shakes out, they have a real chance of going oh-fer on that series of QB picks.
But the Browns’ attempts to fix their QB position haven’t been limited to the draft. In 2010, the Browns also signed Jake Delhomme as a free agent, gave him a signing bonus of $6 million and paid him a year’s salary, after which time they released him to avoid paying an additional $5 million. The Browns also traded a late round draft pick in 2010 in order to acquire Seneca Wallace from Seattle.
Depending on how much you read into Cleveland’s courtship of Chip Kelly and the likely implications that a Kelly hire would have had for the Browns, you could get the sense that they might be willing to throw Brandon Weeden on the scrap pile and start over again. I think that would have been a mistake (ditching Weeden would have been the mistake, not hiring Chip Kelly as that would have been fantastic I’m sure).
If I had to guess, I would say that Brandon Weeden has the potential to be a decent but not great quarterback for a few years. This is based on a few things. First, I think he can make all of the needed NFL throws, which is something. He’s not going to hamstring an offense because he can’t throw to the deep part of the field. However, on the flip side, Weeden probably had about as much talent around him this year as Andrew Luck did, and Andrew Luck wildly outperformed him. So my position is basically that Weeden could be a serviceable QB if given time to adjust to the NFL and also his ceiling probably isn’t anywhere near Luck’s ceiling. But I also don’t think Weeden’s age matters at this point. It might have mattered before the draft last spring, when the Browns should have been doing some math on the expected value of a QB of Weeden’s age, but it doesn’t matter now. The Browns already burned the pick to get Weeden, so the only cost going forward is his salary.
I think there is some room for optimism related to Weeden because he wasn’t 100% bad this year. He was maybe only 80% bad. When Weeden was throwing to Josh Gordon, the QB averaged 8.2 Adjusted Yards per Attempt. That’s very good. Matthew Stafford averaged 8.97 AYA when throwing to Calvin Johnson. So we know that if Weeden is throwing to the right receiver, he’s not awful, and that’s true even if the receiver was a rookie who didn’t play in any college games last year.
Now let me move on to a related point. Since the 2000 draft, NFL teams have taken 36 QBs in the first round, while they have taken just 52 wide receivers. That strikes me as being too low for wide receivers. If we added up team snap counts, would receiver snap counts be greater than QB snap counts by 2X? 2.5X? I’m sure PFF has this info, but let’s just assume 2.5X for now as a team will start 2 outside receivers and then they’ll have a mix of 3 and 4 wide receiver sets as well. So if receivers were drafted at the same rate as QBs and proportionate to snap counts, closer to 90 WRs would have been taken in the first round since 2000.
This strikes me as being a case where teams aren’t correctly gauging supply and demand. Even though the elements of a passing game are highly interrelated, they tend to view their quarterbacks in isolation and then go looking for them in the draft even though all of the other teams are going through the same haystack hoping to find the same needle. I think that given the price bubble that essentially exists in the draft related to QBs, teams should try to fix their passing games in a way that is more contrarian in nature. Instead of going back to the draft repeatedly to try to find that QB, use the pick on a WR instead and try to make the game easier on your QB. To put it another way, would Weeden have been as bad if every receiver he was throwing to could produce at the level of Josh Gordon?
Let’s return to the Browns’ picking of QBs in the draft. Consider that when Cleveland picked Brady Quinn in 2007, the next player off the board was Dwayne Bowe. When the Browns took Colt McCoy in 2010, the next receiver off the board was Eric Decker. You can actually even go further back and see that when the Browns took Charlie Frye in the 3rd round in 2005, the next WR off the board was Chris Henry, who had a short but promising career before he died. Cleveland was burning through picks taking QBs, and while that is a very important position, they were probably leaving better players on the board when they did it.
This strategy might not even be limited to the draft. You could also do the same thing in free agency. Consider that Alex Smith will be a popular name that will come up as teams try to put a band-aid on their QB position. Alex Smith has about a $9 million cap hit this year, so that might be a good gauge as to his cost. Let’s say that instead of using money to sign Alex Smith, who is a band-aid at best, you used it to sign Mike Wallace. It’s reasonable to assume that Mike Wallace could be had for about the cost of Alex Smith because Vincent Jackson was probably a similar (or better) quality free agent WR and he is on an $11 million/year contract with no guaranteed money. So what would happen if the Browns tried to fix their QB situation by adding Mike Wallace instead of a QB?
Look at these two passing units and tell me which one you would prefer:
| Scenario 1 | Scenario 2 | |
|---|---|---|
| QB | Brandon Weeden | Alex Smith |
| WR | Mike Wallace | Travis Benjamin |
| WR | Josh Gordon | Josh Gordon |
| WR | Greg Little | Greg Little |
I would personally be a lot more optimistic about the scenario involving Brandon Weeden and Mike Wallace. Scenario 1 seems like a huge improvement for the Browns, while Scenario 2 seems like maybe a mild improvement. Looking at the same issue from another angle, if you were a defensive coordinator, which unit would you rather go up against? This strategy just focuses on the idea that you can get a lot of wide receiver for the price of a mediocre (at best) quarterback. That’s true in the draft, and it’s probably true in free agency as well.
I think there are two potential objections to my strategy which essentially focuses on the relative supply/demand opportunities that exist in the QB and WR markets. Those objections are as follows: The Arizona Cardinals, The Kansas City Chiefs.
Both the Cardinals and the Chiefs did the equivalent of trying to pile up at WR when they took Michael Floyd and Jonathan Baldwin in the draft. But the problem with those draft picks is that in each case, the teams took guys who hadn’t really dominated at the college level and we know that receivers who don’t dominate their college games have longer odds to be good pro receivers. Models that project college wide receivers to the pros tend to place emphasis on touchdowns, of which Michael Floyd had just 9 in his senior year at Notre Dame, and Jon Baldwin had just 5 in his last year at Pitt. We can look at a team like the Packers in order to see how this strategy might be executed more effectively. Greg Jennings and Jordy Nelson were 2nd round picks who both scored extremely well on algorithmic projection systems coming out of college. Jennings had 14 touchdowns in his senior year at Western Michigan, while Nelson caught close to 50% of all of the yards that Josh Freeman threw in 2007 at KSU. Nelson also scored 11 touchdowns that year. Randall Cobb is another name that looks good if you add up his rushing and receiving touchdowns, as he scored 12 combined touchdowns in his last year at Kentucky. Aaron Rodgers is probably an otherworldly QB, but the Packers also haven’t been sitting on their hands, making him do all of the work. They’ve been ensuring that he has the weapons he needs in the passing game.
A formula that explains NFL passing success would be difficult to nail down because you have issues projecting the success of individual pieces and you have issues figuring out how the pieces will interact with each other. For instance, Wes Welker is a very good receiver and Tom Brady is a very good QB. But it’s probably also the case that they work better with each other than either of them would work with another similar quality player. For this reason, you can’t really blame NFL teams that have a difficult time isolating their problems when they try to fix their QB position. What I’m arguing though is that trying to fix your QB position is a proposition that includes high costs and low success rates, while the wide receiver market has more opportunities for value.
If you can fix your team by replacing your QB with a can’t miss prospect like Andrew Luck, then you should do it. But Andrew Lucks don’t come along very often and this strategy is one that acknowledges that reality and looks for ways to improve a passing game through relative value opportunities.
Reggie Wayne Career Graphs
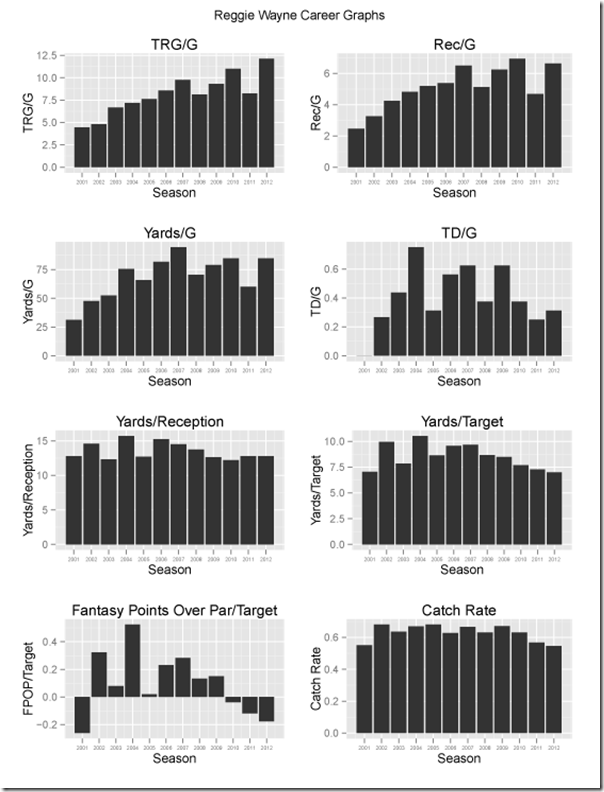
One of the great things about using R for analysis (as opposed to Excel for instance) is that R code makes it easy to repeat whatever it is you’re doing. When the fantasy season ended I just pulled up the code that I’d used to generate last year’s Crop Report and I ran it again so that I could have all of the graphs for this season. The page below is an excerpt which shows Reggie Wayne’s career by numbers.
A few notes: TRG = targets. Fantasy Points Over Par is an efficiency measure that is kind of like FP/Target, except that it is also adjusted for field position because targets from the red zone are more valuable than targets from your own 20.
Drilling Down on Coaching Moves: The Firing of Norv Turner
I threw together the chart below as a quick illustration of the trajectory of the San Diego franchise over the past decade. It shows the Simple Rating for the Chargers over that time and then I’ve drawn a box in to illustrate where the Marty Schottenheimer era ended and the Norv Turner era began.
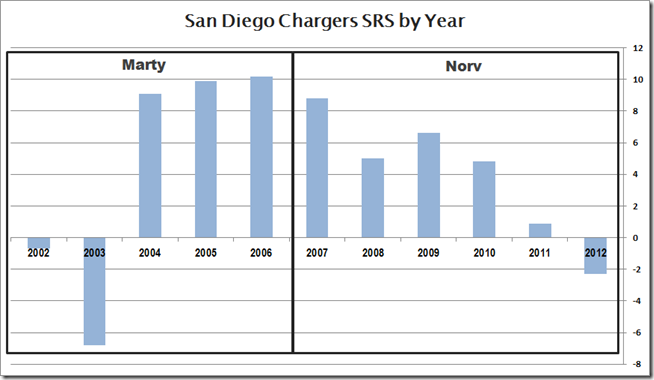
To make it easy to understand what the Chargers’ SRS in 2006 would be like, you might think of the 49ers’ 2012 team, which also has an SRS of about 10 positive points.
One of the things that we see with NFL teams is that they sometimes make decisions where they are choosing between a known quantity (that they might find sub-optimal) and an unknown quantity, and they will often choose the unknown quantity just to make a change. This is a mindset that goes “We’re not where we want to be right now, so any change must get us closer to where we want to be.” That mentality probably has some application with a losing team, but with winning teams it will more often than not lead to the franchise going in the wrong direction. This is simple probability at play. If you have a coach whose lifetime winning percentage is .613 and has been recently winning, your expectation when you fire him is that you are going to be hiring a worse coach. It’s kind of like in blackjack if you were to hit on a 17 when the dealer is showing a face card. It might seem like you have to do something in order to beat that expected 20 that the dealer might have, but the action you take (hitting) is actually going to be worse for your odds of winning.
The Chargers probably have bigger problems than just Norv Turner, as their personnel also seems to be a mess now. But I don’t think it’s debatable that the Chargers fired a good coach and replaced him with a coach who is maybe average. Again, we have to worry about the decision making ability of franchises that can’t understand the odds when they make choices like that.
Drilling Down on Coaching Moves: The Firing of Lovie Smith
If you think about managing an NFL team as a formula, you would break it into a dependent variable (maybe winning, or point differential), and then a series of independent variables (things like coaching, scheme, personnel, luck) that will eventually give you that depenedent variable. So maybe it would be:
POINT DIFFERENTIAL = COACHING + PERSONNEL + STRENGTH OF SCHEDULE + LUCK
My outlook is that a lot of NFL teams have a tough time figuring out how to win because they don’t understand their dependent variable very well and they also have a tough time isolating the independent variables.
To put it another way, they mistake W/L records for the dependent variable because of their “stats are for losers” mindset and this ends up infecting a lot of other decisions that they make. If teams don’t even know the dependent variable in the formula, it’s unlikely that they’ll be able to solve for any of the independent variable values.
The firing of Lovie Smith strikes me as a move that doesn’t contemplate winning in the NFL as a formula. To start with, the 2012 Bears were actually probably a little better than their 10-6 record if you look at Expected Win/Loss, where they would have been a little closer to 11 wins than 10 wins. Expected win/loss has more predictive power on following year wins than actual win/loss records do. So I would argue that the Bears made a decision based on the wrong dependent variable when they applied the NFL’s results oriented mentality.
But if you were going to look at the Bears and try to figure out what things need to be addressed in order to make improvements in the organization, what changes would you make, and would a coaching change be needed in order to improve the team? It strikes me that a coaching change would be low on the order of priorities. I realize that the Bears have missed the playoffs a number of times recently, but Smith is still the coach that took them to a Super Bowl and has only had two years of negative SRS during his tenure. He took over a team that had only been positive in SRS one time in the seven previous years.
So what changes would you make to the Bears if you were going to leave in place the parts that aren’t the problem and you were going to try to improve the parts that are a problem? The defense seems fine. They were one of the best, or the best, defense in the league this year depending on which numbers you subscribe to. The special teams seem fine as they were top 10 in the league according to Football Outsiders.
Most of the offensive pieces also seem fine. The Bears have one good wide receiver in Brandon Marshall and one promising young wide receiver in Alshon Jeffery. Jay Cutler isn’t great, but you can win with him. Matt Forte seems like a fine running back and fits with the kind of offense that works well in the NFL today where running backs are as valuable for their receiving skills as their running abilities. The major glaring weakness for the Bears seems to be their offensive line. It stinks. Since Jay Cutler got to Chicago, they’ve given up the 2nd most sacks in the league over that time.
But I think a reasonable question to ask is whether firing Lovie Smith is going to cure this issue with the Bears line, or whether you could address that issue independently and keep Lovie Smith on as coach given that he appears to be an above average NFL coach? That’s obviously a rhetorical question and I would argue that the Bears offensive line probably shouldn’t be any better than it is right now. Here are the Bears’ draft picks in rounds 1-3 going back to 2006.
| Year | Rnd | Pick | Player | POS | From | To |
|---|---|---|---|---|---|---|
| 2006 | 2 | 42 | Daniel Manning | DB | 2006 | 2012 |
| 2006 | 2 | 57 | Devin Hester | DB | 2006 | 2012 |
| 2010 | 3 | 75 | Major Wright | DB | 2010 | 2012 |
| 2011 | 3 | 93 | Chris Conte | DB | 2011 | 2012 |
| 2012 | 1 | 19 | Shea McClellin | DE | 2012 | 2012 |
| 2007 | 2 | 62 | Dan Bazuin | DE | ||
| 2011 | 2 | 53 | Stephen Paea | DT | 2011 | 2012 |
| 2009 | 3 | 68 | Jarron Gilbert | DT | 2009 | 2012 |
| 2006 | 3 | 73 | Dusty Dvoracek | DT | 2007 | 2008 |
| 2008 | 3 | 90 | Marcus Harrison | DT | 2008 | 2010 |
| 2012 | 3 | 79 | Brandon Hardin | FS | 2012 | 2012 |
| 2007 | 3 | 94 | Michael Okwo | LB | ||
| 2011 | 1 | 29 | Gabe Carimi | OL | 2011 | 2012 |
| 2008 | 2 | 44 | Matt Forte | RB | 2008 | 2012 |
| 2007 | 3 | 93 | Garrett Wolfe | RB | 2007 | 2010 |
| 2008 | 1 | 14 | Chris Williams | T | 2008 | 2012 |
| 2007 | 1 | 31 | Greg Olsen | TE | 2007 | 2012 |
| 2012 | 2 | 45 | Alshon Jeffery | WR | 2012 | 2012 |
| 2008 | 3 | 70 | Earl Bennett | WR | 2008 | 2012 |
| 2009 | 3 | 99 | Juaquin Iglesias | WR | 2009 | 2011 |
If I didn’t know anything about the Bears, and only looked at that table, I would expect their offensive line to be bad. Over a seven year span, they took only two linemen in the first three rounds. They used a bunch of their picks to take defensive players and they used two first round picks to acquire Jay Cutler in a trade.
There are a lot of issues at play when any coach is fired and I guess it’s possible that the Bears could hire a better coach than Lovie Smith. But the expectation that they should have when they hire a coach is not that the new coach would be better, as most NFL coaches are actually probably worse than Lovie. Also, the Bears shouldn’t confuse their line problem with a coaching problem, which is what I think a lot of teams do. I guess it’s conceivable that Lovie Smith was the reason that the Bears haven’t addressed their offensive line issues, but the fix to that problem seems as simple as telling Lovie that you think he’s a good coach, but he stinks at addressing offensive issues in the draft and some of that control has to be taken out of his hands.
I think the problem with a lot of decision making in the NFL is that it’s tough to expect that a team that would confuse its offensive line woes with coaching woes is going to be any good at making the necessary changes in order to actually improve. If you had a doctor that couldn’t tell the difference between soft tissue damage and damage to bones, would you expect that doctor to be any good a prescribing treatments?
The NFL’s Most Valuable Player is… Russell Wilson?
Apologies in advance for jumping the gun on naming a 2012 NFL MVP. I realize that there are still two weeks left in the regular season, but I had time to write this post today, so to hell with the NFL’s 17 week schedule!
A few weeks ago I mentioned on Twitter that I thought that in order to name a player the MVP, you also had to believe that the player was the best at their position. For instance, if you say that Andrew Luck is the most valuable player because of the win difference he’s had for the Colts, you’re essentially making the award one of circumstance. It’s not actually about value then, it’s about relative value and in theory a player benefits from playing on a worse team. During some back and forth, someone rightly suggested that the MVP should also take into account salary. I can’t remember who said it, and I apologize to whoever it was for forgetting, but this made total sense to me. In a salary cap league, each team has limited resources to work with and they should be primarily concerned with how much value they get out of every dollar they spend under the salary cap. With that idea in mind, I figured I would look at some Advanced NFL Stats numbers and some salary info from Spotrac to name a MVP (or a 15 week MVP anyway).
First, here are the top 11 players in Win Probability Added per Advanced NFL Stats. You can see that they’re all quarterbacks. Calvin Johnson actually has slightly greater WPA than Russell Wilson, but we don’t need to look at him because once we adjust for salary, his name won’t be important.
| Rank | Player | Team | G | WPA |
|---|---|---|---|---|
| 1 | 2-M.Ryan | ATL | 14 | 4.71 |
| 2 | 12-A.Rodgers | GB | 14 | 4.32 |
| 3 | 12-T.Brady | NE | 14 | 4.28 |
| 4 | 12-A.Luck | IND | 14 | 4.01 |
| 5 | 9-T.Romo | DAL | 14 | 3.84 |
| 6 | 8-M.Schaub | HST | 14 | 3.45 |
| 7 | 7-B.Roethlisberger | PIT | 11 | 2.92 |
| 8 | 18-P.Manning | DEN | 14 | 2.85 |
| 9 | 10-R.Griffin | WAS | 13 | 2.76 |
| 10 | 1-C.Newton | CAR | 14 | 2.69 |
| 11 | 3-R.Wilson | SEA | 14 | 2.47 |
My understanding of WPA is that it essentially measures a team’s chance of winning before and after each play, and then gives the players involved credit for the change in probability that occurred during the play. Because a team’s probability of winning will vary from 0 to 1, WPA can also be added cumulatively (I think) to come up with Wins Produced, which would be the same thing as the WPA shown in the table above. Plays at the end of the game are what are known as high leverage plays – they swing the probabilities more than plays at the beginning of games – so you can see Andrew Luck’s comeback drives showing up in his WPA number.
In the table below I’ve added salary cap hits from Spotrac and then also added a column which I’m calling Wins Per Million. When the quarterbacks are sorted by Wins Per Million, you can see that the ordering is very different.
| Rank | Player | Team | G | WPA | Cap Hit | Wins Per Million |
|---|---|---|---|---|---|---|
| 11 | 3-R.Wilson | SEA | 14 | 2.47 | $544,850.00 | 4.5334 |
| 4 | 12-A.Luck | IND | 14 | 4.01 | $4,015,000.00 | 0.9988 |
| 9 | 10-R.Griffin | WAS | 13 | 2.76 | $3,839,836.00 | 0.7188 |
| 10 | 1-C.Newton | CAR | 14 | 2.69 | $5,005,659.00 | 0.5374 |
| 3 | 12-T.Brady | NE | 14 | 4.28 | $8,000,000.00 | 0.5350 |
| 2 | 12-A.Rodgers | GB | 14 | 4.32 | $9,000,000.00 | 0.4800 |
| 5 | 9-T.Romo | DAL | 14 | 3.84 | $8,469,000.00 | 0.4534 |
| 1 | 2-M.Ryan | ATL | 14 | 4.71 | $12,990,000.00 | 0.3626 |
| 7 | 7-B.Roethlisberger | PIT | 11 | 2.92 | $9,895,000.00 | 0.2951 |
| 6 | 8-M.Schaub | HST | 14 | 3.45 | $11,700,000.00 | 0.2949 |
| 8 | 18-P.Manning | DEN | 14 | 2.85 | $18,000,000.00 | 0.1583 |
This table shows in part the ridiculous value that can be found in the draft due to the new CBA. The top four QBs in terms of Wins Per Million are all post-CBA drafted players. Russell Wilson’s 2.47 wins have cost the Seahawks only about a half a million in salary, which means that he’s produced about 4 times as many Wins Per Million as the next closest player. I think Wilson probably looks even more impressive given that if you broke all of the NFL’s receiving units into teams and then had a draft where units were picked together, the Seahawks unit would be in the bottom half. It just seems like it would be pretty easy to name 15 better WR units in the league. Russell Wilson probably won’t even win rookie of the year, let alone MVP, but I do think that the table above is illustrative of real value. If you’re paying your QB about 1/20th of what most teams are paying their QB, then you have more money to go out and sign quality veterans at other positions.
There’s obviously a value strategy to be found in having a young QB under the new CBA. But I also think it’s important to remember that producing wins is the threshold issue here. Unless the QB is actually producing wins, teams are at risk of ending up in the dangerous place where you have management questioning whether a QB is “the guy”, or even worse, having ownership wondering if management is the right group (see Browns, Cleveland and Jaguars, Jacksonville). Teams that find themselves in that place are at risk of going through pointless coaching changes, pointless swapping of QBs and really just lost years because they find it impossible to self-diagnose their own problems.
The one other issue that I think is worth discussing here is that while it might seem like the CBA lowers the stakes of the early draft picks to a level that allows teams to make mistakes (the salary penalties are lower), the reality is that it also creates a “relative strength” issue as well. In poker it’s great to have a flush unless someone else has a full house. So you always have to be concerned with how your hand compares to your competition. The new CBA does the same thing. It creates value for teams picking near the top of the draft, but they should all be worried about how much value other teams are extracting out of those draft picks. Nothing that happens in the NFL takes place in a vacuum. It’s all relative to what the other teams are doing. So teams still have to be worried about getting excess value out of the early picks.
Comparing Matt Ryan, Matthew Stafford, and Joe Flacco
On the way to making a point on Twitter last night I somehow ended up in a foxhole with Joe Flacco, defending him against an onslaught of comments which basically said that he sucks. That was sort of an odd place for me to be, given that I hadn’t spent a lot of time thinking about Flacco at all before then. The point I set out to make was basically that NFL teams drafting quarterbacks should look at their rosters and determine whether they would be able to win with a Flacco level quarterback, and if they don’t think that they would be good enough to win with him, then they have bigger problems than just QB. I think Flacco is basically a median level QB that you could expect to get in a draft. Maybe half of the QBs you draft would be worse than Flacco, and half of them would be better than Flacco.
Related to Flacco I also said that I think that if you gave him the receivers that Matt Stafford or Matt Ryan have, there wouldn’t be any difference between Flacco and those other quarterbacks (who largely enjoy the perception of being good quarterbacks, while many perceive Flacco as a bad quarterback). To further this case, let me start out by comparing the three quarterbacks in terms of the quality of their receivers. The easiest way to do this is to just compare the salaries, or salary cap hits, of each QB’s top receivers. Salary gives us some sense as to the relative demand that each player would have in the NFL market. It won’t be a perfect measure, but it will be a good place to start.
Cap Hits of Falcons Top Receivers (Source: Spotrac)
| PLAYER | POS. | CAP FIGURE |
|---|---|---|
| Roddy White | WR | $8,225,000 |
| Tony Gonzalez | TE | $5,900,000 |
| Julio Jones | WR | $3,678,125 |
| Harry Douglas | WR | $2,000,000 |
| Total | $19,803,125 |
Cap Hits of Lions Top Receivers
| PLAYER | POS. | CAP FIGURE |
|---|---|---|
| Calvin Johnson | WR | $11,531,946 |
| Brandon Pettigrew | TE | $2,336,250 |
| Tony Scheffler | TE | $2,050,000 |
| Titus Young | WR | $830,313 |
| Total | $16,748,509 |
Cap Hits of Ravens Top Receivers
| PLAYER | POS. | CAP FIGURE |
|---|---|---|
| Anquan Boldin | WR | $7,531,250 |
| Jacoby Jones | WR | $1,600,000 |
| Torrey Smith | WR | $770,224 |
| Ed Dickson | TE | $760,833 |
| Dennis Pitta | TE | $663,667 |
| Total | $11,325,974 |
You don’t have to look at the tables for very long to see that the Ravens are asking Joe Flacco to do more with less. The Ravens’ top four ball catchers have a combined cap hit that doesn’t even equal Calvin Johnson’s cap hit. The Falcons’ receivers have a cap hit about 72% higher than the Ravens’ receivers. Torrey Smith is actually probably the Ravens’ best receiver and the Lions passed up the opportunity to take him when they selected Titus Young with the 44th pick of the 2011 draft.
Now let’s look at how these QBs have actually performed this year given the resources that their clubs have asked them to work with. The below table shows the year to-date passing numbers for the three QBs.
| Games | Passing | ||||||||||||||||
|---|---|---|---|---|---|---|---|---|---|---|---|---|---|---|---|---|---|
| Rk | Player | Year | Age | Draft | Tm | G | Cmp | Att | Yds | TD | Int | Sk | |||||
| 10 | Matt Ryan | 2012 | 27 | 1-3 | ATL | 14 | 369 | 539 | 68.5% | 4202 | 27 | 14 | 97.5 | 25 | 7.80 | 7.63 | 6.98 |
| 14 | Joe Flacco | 2012 | 27 | 1-18 | BAL | 14 | 288 | 487 | 59.1% | 3474 | 20 | 10 | 86.2 | 34 | 7.13 | 7.03 | 6.15 |
| 25 | Matthew Stafford | 2012 | 24 | 1-1 | DET | 14 | 374 | 629 | 59.5% | 4252 | 17 | 15 | 78.9 | 28 | 6.76 | 6.23 | 5.67 |
My first thought after looking at the salary tables and the passing numbers table is that the team that has the most money tied up in their receivers also has the best passing game.
To look at the passing numbers a different way, it might help to look at per attempt stats. Here is a table with just yards, touchdowns and interceptions adjusted for attempts.
| Y/A | TD Rate | INT Rate | |
|---|---|---|---|
| Ryan | 7.80 | 5.009% | 2.597% |
| Flacco | 7.13 | 4.107% | 2.053% |
| Stafford | 6.76 | 2.703% | 2.385% |
When I was ranting on Twitter last night, and suggesting that I thought that our perception of Flacco would change if he had say Megatron or the Falcons receivers to throw to, the most common response I got was that I was insane and Flacco isn’t nearly as talented as the other two QBs. But Flacco has actually outperformed Matt Stafford this year in spite of the apparent talent deficit that he has compared to Stafford (people regard Stafford as having rare arm talent), and also in spite of the limited resources that the Ravens have given Flacco to work with. It’s true in part that Stafford is probably just having a down year, perhaps the result of having to face a number of strong defenses. But that doesn’t change the fact that Flacco has still done more with less than Stafford has had to work with. A somewhat common objection on Twitter was that the Ravens run game (and Ray Rice) takes a lot of pressure off of Flacco. But the difference between the Ravens’ run game and the Detroit run game is probably 95% name recognition and maybe 5% actual results. The two teams have almost identical numbers in terms of rushes, yards, yards per carry, rushing touchdowns, and receiving yards to their running backs.
Even if a few people might concede that Flacco might not be far behind Stafford because of Stafford’s down year, most would not put Flacco anywhere near Matt Ryan. But it’s also fairly easy to illustrate that Matt Ryan’s lead over Flacco can be almost entirely explained by Julio Jones. Before Jones got to Atlanta, there was almost no difference between Flacco and Ryan. The table below contains the stats for the two QBs for the 2010 season – i.e. before the Falcons traded a number of draft picks to get Julio Jones.
Comparing Matt Ryan and Joe Flacco – 2010
| Comp | Att | Comp% | Yards | TD | TD% | INT | INT % | Y/A | AYA | |
|---|---|---|---|---|---|---|---|---|---|---|
| Joe Flacco | 306 | 489 | 62.6 | 3622 | 25 | 5.1 | 10 | 2 | 7.4 | 7.5 |
| Matt Ryan | 357 | 571 | 62.5 | 3705 | 28 | 4.9 | 9 | 1.6 | 6.5 | 6.8 |
I don’t want to spend any more time making it look like I think that Joe Flacco is a good quarterback, or saying that he’s underrated. He may be those things, but that’s not really my cause here. My purpose is to point out that pieces on a football team are dependent on each other and while everybody understands this internally, it often doesn’t make it’s way into our assessments of players. Some of the people responding to me last night were Baltimore fans who took the position that Baltimore could never win with Flacco, so they should start looking for another QB. But my stance is that Flacco isn’t any worse than some QBs who play for teams that consider their QB position to be a settled issue. No Atlanta fans are saying that the team should move on from Matt Ryan, even though the primary difference between Ryan and Flacco is the quality of their receivers. No Detroit fans are saying the team should move on from Matthew Stafford, even though his Adjusted Yards/Attempt number is in the bottom half of the league this year and he has the NFL’s best receiver.
Probably the biggest thing that keeps NFL teams from improving is that they have a difficult time parsing out where their problems are and figuring out ways to improve. They mistake having bad receivers for having a bad QB, so they draft a QB and then are surprised when the new QB isn’t any better. But if teams that are taking a QB in the draft wouldn’t take one if they were guaranteed to get a Joe Flacco, then they shouldn’t take one at all because Joe Flacco is probably the median expectation when taking a QB in the first round. About half of the QBs you draft will be better, and half of the QBs you draft will be worse. To illustrate this, I’ve created a list of the first round QB picks going back to 2000 and I’ve annotated that list by noting whether that QB would be better or worse than Joe Flacco. I tried to be pretty charitable on the “BETTER” side, even giving Stafford credit for being better despite the case that I’ve laid out about. I was charitable in the same way with ties, giving both Sam Bradford and Michael Vick credit for a tie. The result is that I think Flacco is a median level 1st round QB, and limiting your sample to just the top 10 picks doesn’t change that at all as Flacco would still be better than half and worse than half. Only if you limited the picks to the first overall pick does Flacco drop below the median and in that case, flipping Sam Bradford and Mike Vick from “TIE” to “WORSE” would bring Flacco right back to median.
| Year | Pick | Player | BETTER/WORSE | Tm | AYA |
|---|---|---|---|---|---|
| 2011 | 1 | Cam Newton | BETTER | CAR | 7.52 |
| 2003 | 1 | Carson Palmer | BETTER | CIN | 6.66 |
| 2004 | 1 | Eli Manning | BETTER | SDG | 6.53 |
| 2012 | 1 | Andrew Luck | BETTER | IND | 6.33 |
| 2009 | 1 | Matthew Stafford | BETTER | DET | 6.40 |
| 2001 | 1 | Michael Vick | TIE | ATL | 6.61 |
| 2010 | 1 | Sam Bradford | TIE | STL | 5.83 |
| 2005 | 1 | Alex Smith | WORSE | SFO | 6.00 |
| 2002 | 1 | David Carr | WORSE | HOU | 5.53 |
| 2007 | 1 | JaMarcus Russell | WORSE | OAK | 5.01 |
| 2012 | 2 | Robert Griffin III | BETTER | WAS | 8.78 |
| 2008 | 3 | Matt Ryan | BETTER | ATL | 7.10 |
| 2006 | 3 | Vince Young | WORSE | TEN | 5.82 |
| 2002 | 3 | Joey Harrington | WORSE | DET | 4.90 |
| 2004 | 4 | Philip Rivers | BETTER | NYG | 7.69 |
| 2009 | 5 | Mark Sanchez | WORSE | NYJ | 5.56 |
| 2003 | 7 | Byron Leftwich | WORSE | JAX | 6.11 |
| 2011 | 8 | Jake Locker | ?? | TEN | 6.81 |
| 2012 | 8 | Ryan Tannehill | ?? | MIA | 6.11 |
| 2006 | 10 | Matt Leinart | WORSE | ARI | 5.50 |
| 2011 | 10 | Blaine Gabbert | WORSE | JAX | 5.11 |
| 2004 | 11 | Ben Roethlisberger | BETTER | PIT | 7.67 |
| 2006 | 11 | Jay Cutler | TIE | DEN | 6.59 |
| 2011 | 12 | Christian Ponder | WORSE | MIN | 5.30 |
| 2009 | 17 | Josh Freeman | TIE | TAM | 6.32 |
| 2000 | 18 | Chad Pennington | TIE | NYJ | 6.87 |
| 2008 | 18 | Joe Flacco | TIE | BAL | 6.86 |
| 2003 | 19 | Kyle Boller | WORSE | BAL | 4.91 |
| 2012 | 22 | Brandon Weeden | ?? | CLE | 5.61 |
| 2004 | 22 | J.P. Losman | WORSE | BUF | 5.67 |
| 2003 | 22 | Rex Grossman | WORSE | CHI | 5.54 |
| 2007 | 22 | Brady Quinn | WORSE | CLE | 4.68 |
| 2005 | 24 | Aaron Rodgers | BETTER | GNB | 8.57 |
| 2010 | 25 | Tim Tebow | WORSE | DEN | 6.53 |
| 2005 | 25 | Jason Campbell | WORSE | WAS | 6.35 |
| 2002 | 32 | Patrick Ramsey | WORSE | WAS | 5.78 |
\
Given the lack of sobriety that NFL teams show when picking QB in the first round, I don’t think very many of them go through the mental steps of asking themselves if they would still make the same pick if it turned out to be the median expectation for the pick, rather than their best hope for that pick. In that regard, I think they are probably pretty similar to a number of the people that responded to me on twitter when I posed the following questions:
Q. If the teams looking to draft QB in first round this year were guaranteed to get Joe Flacco (hypothetical) would they take QB still?
— Fantasy Douche (@FantasyDouche) December 20, 2012
Basically, if you were getting a known quantity, instead of what’s behind door number 2, would you still want it?
— Fantasy Douche (@FantasyDouche) December 20, 2012
When I said “door number 2” I meant the unknown of taking a QB in the first round of the draft.
A number of people said that they would rather take what’s behind door number 2. From a risk standpoint, there’s probably no problem taking what’s behind door number 2. It has close to the same Expected Value of taking Flacco in this hypothetical. But from a team building standpoint I think it’s an interesting question because I think the reason that a lot of people would choose door number 2 is because they don’t think their team would be good enough to win with Flacco at the helm. But that’s essentially a comment on the rest of the team, not a comment on Flacco.
Stats ARE for Losers
This morning I was thinking about the utility of statistics and measurement when it dawned on me that the phrase “stats are for losers” (SAFL) actually is true. Stats are for losers, or at least losers have the most to gain by the application of quantification and measurement.
Just so that I don’t create a straw man here, I want to first go back and revisit the meaning of the SAFL phrase so that I can give due credit to its users. The term “stats” could have any number of meanings. It could mean something like passing yards, or individual achievements. But it could also mean something like WPA, or Win Probability Added, an advanced statistic meant to assign credit for wins. The term “stats” would fit with either use if we don’t drill down a little and look at the way that the phrase is used in the NFL.
In Game Plan I looked at something that former NFL lineman Ross Tucker wrote on SI.com as to the SAFL phrase. That seems like a reasonable place to start given that Tucker was an insider and knows what the phrase means to people in the NFL.
“Stats are for losers.” This is one of my favorites. I was happy to hear Patriots coach Bill Belichick
say this at one of his press conferences a couple of weeks back in reference to a question about
Randy Moss and his lack of production against Carolina. This has long been one of the basic,
behind the scene commandments of life in the NFL and I was delighted Belichick took it
mainstream.The point is that typically you really only hear a team that lost or fell short of their goals talking
about the statistics. For example, we have heard a lot of talk about the Jets No. 1-ranked defense
and rushing offense but those rankings won’t mean anything if they don’t punch their playoff
ticket by beating the Bengals on Sunday night. But the Jets aren’t the only team. Listen to some
of the end of the year press conferences next week after teams that aren’t going to the
postseason wrap up their season. They’ll talk about the areas where they improved, whether it is
the Texans defense or the Broncos pass defense or whatever. But the bottom line is it doesn’t
really matter. Think about it; you very rarely hear the winning teams or coaches talking about
stats because they are focused on next week’s game. That’s because stats, ultimately, are for
losers.
To be fair to Tucker I think we can say that he starts out with a notion of stats as an individual achievement as he is first talking about Randy Moss’ lack of production in one game. But by the end of the excerpt, the concept of stats includes almost anything that isn’t either a “W” or an “L”. So if I am taking the most favorable view of the use of SAFL, I would say that it is in some sense meant to refer to individual achievement, but in another sense, it is meant to throw out measures which aren’t the game outcome. Throwing out measures which aren’t the game outcome is where I’ve taken issue with SAFL in the past.
Let me now switch to an analogy that will help illustrate my point that stats are for losers and that shouldn’t be a derogatory statement. Losers have the most to gain by using stats, measurement, and quantification.
If you think about health, and the measures of health that we might have which would be analogous to a football game, we could talk about things like heart rate, blood pressure, blood sugar, etc (these are stats). An alternate way to talk about health would be to simply say that someone is alive or dead (only the outcome matters). Now think about the people you know, and which people have any sense as to where they might fall on the various health measures. The people most likely to know where they would fall on the various health measures would be the really healthy people (runners know the exact heart rate that is most optimal for training) and the really unhealthy people (people in hospitals have their vital signs measured regularly)! So people who know a lot about their health measures fall at both ends of the health spectrum, and people in the middle know very little about how healthy they are.
Bad NFL teams should pay attention to numbers for the same reason that hospitals pay attention to vital signs for patients who could go either way. You have to have some sense as to how you’re doing now, and whether treatments are causing any improvement for the patient. It would be totally accurate to say that measuring the heart rate is for dead people, as there is I’m sure a very high correlation with people having their heart rate measured and people dying soon after, in the same way that the NFL thinks that stats are for losers. So the problem with SAFL is not that it isn’t true, it’s that it mistakes correlation for causation, and it is derogatory when it shouldn’t be.
Let’s say you ran an NFL team and you were going to hire a new front office and coach to take your franchise in a different direction. How would you actually know if the new group is actually any better than the old group? You could look at wins and losses to know if you’re going in the right direction, but that would probably be misleading. Teams picking at the top of the draft in April are typically both bad and unlucky. They are bad teams, but they also probably had injuries and turnovers go against them the previous year, so while they are bad, they might not be as bad as their record says they were. So how would you measure whether your new front office and coach are going in the right direction if they’re likely to win a few more games anyway (because they’ll be less unlucky)? It seems like it might help to have some alternate measures in place to determine whether you’re going in the right or wrong direction. Game outcomes, which the SAFL crowd says are all that matter, aren’t going to tell you as much as you might think. To return to the health analogy, what if all that doctors could glean from patients was a binary “Alive/Dead”? How successful would doctors be at keeping borderline patients on the good side of that binary description? Wouldn’t it be more helpful to know something like blood pressure and respiratory rate? Then, if the patient died anyway as they do sometimes, would it make any sense to denigrate the attempt to keep them alive by saying that vital signs are for dead people?
One of the things that seems to undermine the application of statistics in football is the idea that a statistic can say whatever you want it to. This is what Vin Scully was talking about when he said that statistics are used much like a drunk uses a lamppost – for support rather than illumination. But that criticism comes from an understanding of statistics as simply a way to end arguments, and ignores the use of statistics as a way to tell you something you don’t know. Bad NFL teams should use statistics and measurement to learn things about their team and about the game of football that they don’t already know, and they should also use numbers to assess their success at turning their franchise around. Stats should be for losers, but the SAFL phrase shouldn’t be derogatory.
I have some more thoughts on this issue that I’ll be going into as I dust off Game Plan in the offseason and start working on a 2nd edition.
Looking at the Career Efficiency of Some #1 WRs
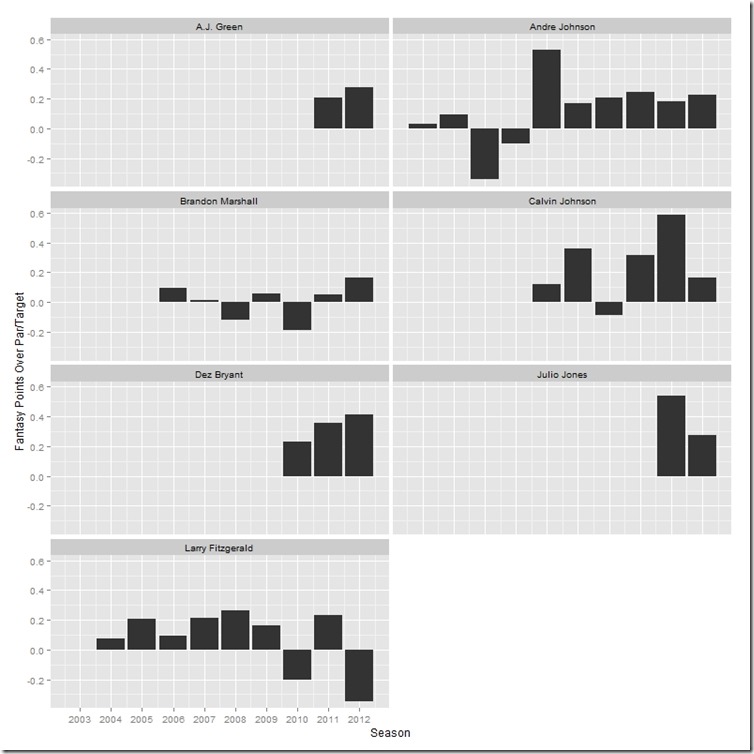
Just a quick post here to throw out a graph that I was looking at this morning. The graph below shows a few #1 WRs and their fantasy efficiency by year using my measure Fantasy Points Over Par. The numbers are broken down on a per target basis and they are an attempt to separate out usage from efficiency.
A few thoughts:
- Receivers are obviously dependent on their quarterback, which is a fundamental issue with any football related stat. You can see that Larry Fitzgerald’s efficiency really got bumpy after Kurt Warner retired.
- Dez Bryant has actually increased his per target efficiency each year that he’s been in the league.
- Brandon Marshall’s number suffers from a combination of two factors I think. First, he has mostly played with average quarterbacks. Second, he drops passes and dropping a pass in the end zone can be costly from an FPOP standpoint. Consider that Marshall has 12 touchdowns on 49 red zone targets over the past three seasons, while Dez Bryant has 13 touchdowns on just 33 red zone targets in that time.
Andre Johnson as Efficient as Ever
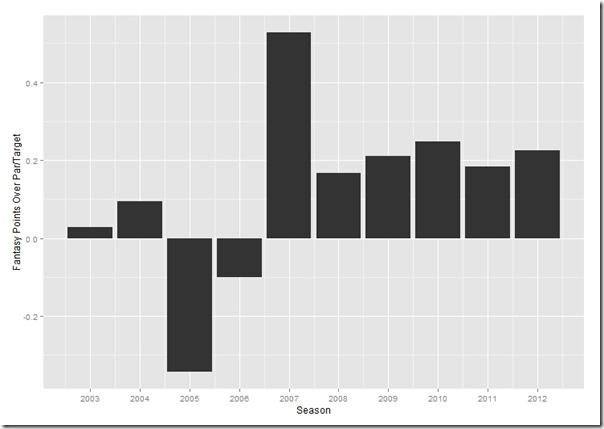
When I wrote my “buy low” post on Andre Johnson in early November, one of the things I pointed to as a reason to buy low was that Johnson had still been an efficient receiver through the first eight weeks of the season. I was looking at some numbers this morning and was impressed that Johnson has been as efficient this year as he has been for most of his career. The graph below shows Johnson’s Fantasy Points Over Par/Target for each season in his career. Fantasy Points Over Par is an efficiency measure which simply looks at each receivers fantasy points produced and then adjusts them for field position. So look at each target and the fantasy points it produces, and then subtract out the average fantasy points produced by a target from that yard line (line of scrimmage).
An efficient #1 WR like Andre Johnson, or Calvin Johnson will typically produce about 0.2 FP/T over the average.
Andre Johnson FPOP/Target by Year
Going into the season I didn’t know what to think of AJ because it was difficult to know how to look at his 2011 season, and I was worried that age might be becoming an issue for him. I essentially just stayed away from him in fantasy drafts. I now think that that decision can be thrown into the “better to be lucky than good” pile as the Texans didn’t need to use him very much over the first eight weeks of the season when they were running the ball down their opponents’ throats. Had their schedule been reversed, and if their most recent five opponents had been played during weeks 1-5, I think my pre-draft decision would have looked pretty silly.
(Note you can tell from the graph the season that Matt Schaub showed up in HOU, which illustrates the difficulty in parsing meaning from a lot of football stats – there is a lot of interaction between players.)
Updated GILLESPIE Projections, Every Player, Every Week
The file linked to below is the same as the file I’ve released in the past, except that this file reflects updates to the season stats for each player based on this week’s games.
As a reminder, I’m reposting my guidance for how you should think about using GILLESPIE projections (see below). Some people also asked about a key for the summary statistics, so here it is:
| Position | Sample Summary | Summary Key |
| RB | 19.5/112.8/5.8/0.7/15.5 | Runs per Game/Yards per Game/Yards per Carry/TD per Game/Rec. Yards per Game |
| WR/TE | 10.4/91.1/8.8/1 | Targets per Game/Yards per Game/Yards per Target/Touchdowns per Game |
| QB | 35.5/262.5/7.4/2.7/0.6/16.9 | Att per Game/Yards per Game/Yards per Att/TD per Game/INT per Game/Rush Yards per Game |
Guidance:
-
GILLESPIE only knows numbers. It doesn’t know anything else. It doesn’t know if a guy is in store for increased usage (Bryce Brown for instance). It doesn’t know if a guy got knocked out in the middle of a game and therefore his per game numbers are off. It doesn’t know if a guy is suddenly the starter (Montell Owens for instance). It only knows numbers.
-
The optimal way for you to use GILLESPIE is to look at the projections, look at the historical matchups, and then apply what you know about the games to make a decision. Don’t just take what GILLESPIE gives you and make a decision based on a number.
-
Each GILLESPIE projection is something of a compromise based on finding relatively similar players against relatively similar defenses. If players are similar on all factors except size (for instance, Megatron’s numbers this year almost look like a Wes Welker season due to the low touchdowns), GILLESPIE doesn’t throw out that match, it just means that match will show up lower in the matches and it might not make it into the projection at all. Each list of comparable matchups is a list of the most comparable matchups, which is to say that there are going to be 30 matchups in there, no matter how close of a match they are to the subject game.
-
It’s fair to simply ignore players that have seen a low number of plays. GILLESPIE won’t tell you anything you don’t already know.
-
For purposes of thinking about the accuracy of GILLESPIE, you can think of it as being like a linear regression, except that it doesn’t require that all variables have linear relationships. So something like player age, which is going to have an upside down u shaped curve, can be included because we’re just going to look for relatively similar aged players for our matchups.
-
The easiest thing to do would be to unzip the file to a folder on your machine and then open the html files from there.
Click on the link below, then select “Download” from the “File” menu in the upper left.
https://docs.google.com/open?id=0BxPDTugitfokTlR3cFVabW1rRTg
Receiving Leaders Since Week 6
Just a quick post here as I was going through the numbers and saw some interesting things when I filtered the data to include only games from week 6 forward.
The table is sorted by standard points, but I’ve also included PPR scoring in one of the columns.
All numbers are per game.
| Tm | Name | Pos | AGE | WEIGHT | TRGS/G | YDS/G | TDS/G | Y/R | Y/T | FP/G | PPR FP/G |
|---|---|---|---|---|---|---|---|---|---|---|---|
| NE | Rob Gronkowski | TE | 23 | 265 | 8.20 | 90.60 | 1.40 | 15.10 | 11.05 | 17.46 | 23.46 |
| DET | Calvin Johnson | WR | 27 | 236 | 12.63 | 125.63 | 0.50 | 17.63 | 9.95 | 15.56 | 22.69 |
| DAL | Dez Bryant | WR | 24 | 220 | 8.75 | 88.63 | 1.00 | 14.18 | 10.13 | 14.86 | 21.11 |
| CHI | Brandon Marshall | WR | 28 | 230 | 11.71 | 97.14 | 0.71 | 12.14 | 8.29 | 14.00 | 22.00 |
| CIN | A.J. Green | WR | 24 | 211 | 10.00 | 87.71 | 0.86 | 15.35 | 8.77 | 13.91 | 19.63 |
| DEN | Demaryius Thomas | WR | 25 | 229 | 8.14 | 87.00 | 0.86 | 15.62 | 10.68 | 13.84 | 19.41 |
| JAC | Cecil Shorts | WR | 25 | 205 | 9.14 | 88.43 | 0.71 | 17.69 | 9.67 | 13.13 | 18.13 |
| HOU | Andre Johnson | WR | 31 | 225 | 11.71 | 118.71 | 0.14 | 14.58 | 10.13 | 12.73 | 20.87 |
| TB | Vincent Jackson | WR | 29 | 230 | 8.13 | 88.75 | 0.63 | 20.88 | 10.92 | 12.63 | 16.88 |
| NO | Jimmy Graham | TE | 26 | 259 | 7.83 | 67.00 | 0.83 | 11.82 | 8.55 | 11.70 | 17.37 |
| GB | Randall Cobb | WR | 22 | 192 | 8.43 | 61.57 | 0.86 | 10.26 | 7.31 | 11.30 | 17.30 |
| SEA | Sidney Rice | WR | 26 | 202 | 5.86 | 60.57 | 0.86 | 16.31 | 10.34 | 11.20 | 14.91 |
| GB | Jordy Nelson | WR | 27 | 217 | 5.33 | 61.50 | 0.83 | 16.04 | 11.53 | 11.15 | 14.98 |
| NE | Wes Welker | WR | 31 | 185 | 11.57 | 82.86 | 0.43 | 10.74 | 7.16 | 10.86 | 18.57 |
| WAS | Pierre Garcon | WR | 26 | 210 | 7.00 | 68.00 | 0.67 | 12.75 | 9.71 | 10.80 | 16.13 |
| SD | Danario Alexander | WR | 26 | 221 | 6.67 | 77.83 | 0.50 | 17.96 | 11.68 | 10.78 | 15.12 |
| ATL | Julio Jones | WR | 23 | 220 | 6.86 | 88.29 | 0.29 | 19.31 | 12.88 | 10.54 | 15.11 |
| DEN | Eric Decker | WR | 25 | 215 | 6.43 | 51.29 | 0.86 | 12.82 | 7.98 | 10.27 | 14.27 |
| MIN | Percy Harvin | WR | 24 | 184 | 9.25 | 67.50 | 0.50 | 11.25 | 7.30 | 9.75 | 15.75 |
| STL | Chris Givens | WR | 23 | 198 | 7.17 | 74.50 | 0.33 | 15.41 | 10.40 | 9.45 | 14.28 |
| OAK | Denarius Moore | WR | 24 | 194 | 7.63 | 56.50 | 0.63 | 17.38 | 7.41 | 9.40 | 12.65 |
| NO | Lance Moore | WR | 29 | 190 | 6.71 | 76.43 | 0.29 | 16.21 | 11.38 | 9.36 | 14.07 |
| TB | Mike Williams | WR | 25 | 212 | 7.88 | 62.38 | 0.50 | 15.59 | 7.92 | 9.24 | 13.24 |
| CLE | Josh Gordon | WR | 21 | 225 | 6.14 | 66.14 | 0.43 | 18.52 | 10.77 | 9.19 | 12.76 |
| OAK | Brandon Myers | TE | 27 | 250 | 8.88 | 61.63 | 0.50 | 9.30 | 6.94 | 9.16 | 15.79 |
| GB | James Jones | WR | 28 | 208 | 6.50 | 49.67 | 0.67 | 12.42 | 7.64 | 8.97 | 12.97 |
| NYG | Victor Cruz | WR | 26 | 204 | 8.71 | 63.57 | 0.43 | 14.35 | 7.30 | 8.93 | 13.36 |
| NO | Marques Colston | WR | 29 | 225 | 7.43 | 54.86 | 0.57 | 11.64 | 7.38 | 8.91 | 13.63 |
| CAR | Steve Smith | WR | 33 | 185 | 8.86 | 71.71 | 0.29 | 15.69 | 8.10 | 8.89 | 13.46 |
| IND | Reggie Wayne | WR | 34 | 198 | 11.50 | 81.25 | 0.13 | 12.50 | 7.07 | 8.88 | 15.38 |
| CAR | Brandon LaFell | WR | 26 | 211 | 6.33 | 58.50 | 0.50 | 16.71 | 9.24 | 8.85 | 12.35 |
| JAC | Justin Blackmon | WR | 22 | 207 | 7.29 | 62.57 | 0.43 | 16.85 | 8.59 | 8.83 | 12.54 |
| ATL | Roddy White | WR | 31 | 208 | 8.86 | 77.43 | 0.14 | 14.65 | 8.74 | 8.60 | 13.89 |
| BAL | Torrey Smith | WR | 23 | 205 | 8.57 | 51.71 | 0.57 | 15.74 | 6.03 | 8.60 | 11.89 |
A Love Sonnet – Ode to the Big Wide Receiver
I gotcha! No love sonnet here, just a dork chart.
This will be a quick post just to add some additional information to a series of tweets I threw out there this morning on bigger wide receivers. If you look at the scoring leaders in a standard fantasy scoring format, you’ll see that the list is dominated by the bigger wide receivers. Most of the Top 10 list goes over 210 pounds. The same isn’t exactly true in PPR scoring, where smaller guys like Wes Welker and Victor Cruz make it onto the list, along with some guys who just miss the 210 cutoff (like Roddy White). But I tend to like the bigger WRs because I think they’re sort of a corollary to the recent emergence of the TE as a scoring position in football. Tight ends and bigger wide receivers tend to be more efficient in the red zone, which means that they stay relevant all over the field.
On twitter I mentioned that since 2005, out of the 43 seasons of at least 1000 yards and 10 touchdowns, 30 of those seasons came from players who were at least 210 pounds. A few people asked about the size of the average receiver – essentially, is the 1000/10 group any different in terms of size than the total universe of WRs? – so I threw a quick graph together to illustrate. The below density plot shows both the weight distribution of all wide receivers, along with the weight distribution of receivers who averaged a 1000/10 pace. The dotted line is the distribution of all wide receivers. The solid line is the group of 1000/10 pace seasons. You can see that the solid line’s distribution is to the right of the dotted line, which is to say that guys who were in the 1000/10 group were larger than all wide receivers. In fact, the median weight for the receivers in the 1000/10 group was 210 pounds, while the median weight for all WRs was just 200 pounds. If you start adding TEs into the mix (which I haven’t done below) it ends up pulling up the median for that 1000/10 group. But I left TE out so as not to confound the answer to the question of whether the 1000/10 WRs were actually any larger than all WRs.
Note that if you looked at the same issue in terms of height, it would probably come out similarly as the two variables are likely highly correlated.
Solid line – Group of WRs on 1000yd/10td pace
Dotted Line – All WRs
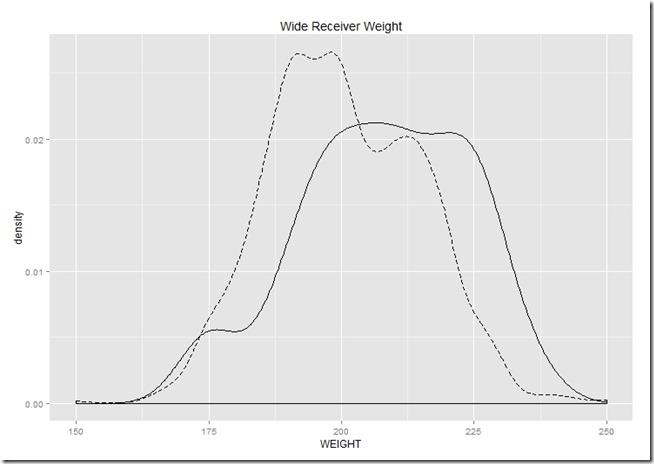
One interesting note: You can see a little bump on the left hand side of the distribution for the 1000/10 group. That’s for Marvin Harrison, who at 175 pounds was still regularly in the 1000/10 group.